Industrial & OSHA Noise Control
Using Sound Intensity to Diagnose Motor-Pump Noise
VACC recently participated in a project involving the design of a wastewater treatment plant. Design noise levels were exceeding acceptable limits, so all approaches to noise reduction were being considered. The dominant noise source was an 1800 RPM motor driving a pump through a belt-driven pulley assembly. Two motor options were available to the designer: a standard 1800 RPM motor and a more expensive 1200 RPM motor offering 7 dBA less noise.
The critical design question was: which was the dominant sound source, the motor or the pump?
If the motor was dominant, then reducing motor noise would reduce total motor-pump system noise, reducing total noise in the industrial space, which would be well worth the extra cost. On the other hand, if the motor was not the dominant noise source, then replacing it with the quieter, more expensive motor would be a waste of money.
Our mission was to make detailed measurements on a representative motor-pump assembly, in order to determine the relative noise contributions of motor and pump. The motor-pump system was operating on an industrial floor crowded with other machinery. When you need a spatially detailed characterization of the radiated sound power of a complex source, located among a number of other invading sound sources, a simple pressure level measurement won’t do the job. You need to measure sound intensity. Here’s why.
Sound Pressure vs. Sound Intensity
For sound measurement tasks that simply require sound pressure levels at a receiver location, such as an office, residence or factory floor, Sound Level Meter (SLM) measurements can be satisfactory. For example, SLM’s can report overall A-weighted dB-SPL levels to determine compliance with residential noise codes or OSHA industrial regulations. Digital SLM’s can also provide octave and 1/3-octave band spectra to determine the spectral content of the noise. This can assist in remediation – for example, to select windows that adequately insulate against low-frequency traffic noise.
However, projects that require a detailed characterization of a sound source require Sound Intensity. For example, product or safety regulations might require certification of the total radiated sound power of a consumer product, an industrial machine or a construction vehicle. This can be difficult to determine from sound pressure alone. To accomplish this with pressure measurements, the device under test (DUT) must be located in a space with known acoustic characteristics (either anechoic or known reverberation) and it must be adequately surrounded with up to a dozen measurement microphones, in order to capture the 360-degree radiated pressure field. This measurement can be further complicated if the DUT is located in a noisy environment or if the measurement must be conducted quite close to the DUT (for logistical reasons such as a crowded factory floor). In cases like these, measured pressure levels can be spuriously elevated, by surrounding noise or the reactive (non-radiating) pressure field.
Introduction to Sound Intensity
The key to a sound intensity measurement is that it is directionally sensitive. It measures the power flux (Watts per square meter) radiated directionally from the DUT and ONLY from the DUT. Sound energy from any other direction is excluded. This includes ambient noise in the room and non-radiated (reactive) noise in the near acoustic field of the source.
The sound intensity probe functions like a stethoscope on the chest of the patient: it hears only what’s inside the patient’s chest. Sound intensity is powerful in its ability to exclude spurious noise and its ability to localize specific areas (and sources) of sound radiation from the DUT.
How do you operate a sound intensity system? With a modern software-based intensity system, the user scans the probe across one face of the DUT, while a digital camera watches the probe in order to track probe position. The software samples sound intensity and probe location in real-time, many times per second, producing as many as 3000 intensity sample points at known locations on a virtual “measurement plane”.
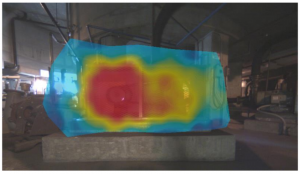
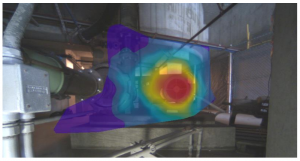
The software then delivers a color heat map of intensity, overlaid on a photograph of the target. See the figures below. The software can also export a summary of pressure, intensity and power levels over octave or 1/3-octave bands, with A, C or Z weighting.
Motor vs. Pump
Our results showed that the motor was significantly noisier than the pump. This was clear from the sound intensity “heat maps” delivered by our system, which plot sound intensity across the surface of the DUT.
Our maps show clearly that the motor dominates. This enabled the client to make an informed and cost-effective decision between the two motor choices, knowing that the motor was the dominant noise source.
In the following front view, motor and pump are side by side (motor on the left). The pulley assembly (motor pulley on the left, larger pump pulley on the right) is slightly visible through the heat map. The motor sound intensity is about 4 dBA above the pump.

In the following rear view (motor on the right), motor sound intensity is about 8 dBA above the pump. The scan is spatially truncated on the left side due to interference with the pump’s large output pipe. The heat map was confirmed audibly: we could hear motor noise coming from its rear fan exit and the sound was quite localized, as shown in the heat map.

Total Radiated Sound Power
Total radiated sound power can also be calculated using sound intensity. Total power is the sum of the power flux through the 5 faces (4 sides plus overhead) of a virtual “measurement box” enclosing the DUT. In practice, the user performs a separate scan of each face, then sums their respective sound powers (which are calculated and reported by the intensity software) to get the total sound power radiated by the DUT. This is the true radiated power, independent of contaminating noise in the measurement environment and free of the non-radiated (reactive) near sound field.


